Category Archives: CS Challenges

CS Challenge W10

Question:

INSTRUCTIONS Copy this card, assign it to yourself and add your name to the title. All submissions should be on your copy. Unclick “Keep Members” when copying the card. Move your card to “Week X Completed” when finished. Do not check the “Due Date” when finished, I will check this once reviewed.

CS W10 CHALLENGE
Create a challenge that showcases a software/tool/function/etc. that you find useful and would like to pass on to others! Your challenge should include a concise tutorial of how to complete the challenge, along with what the goal of the challenge is. The tutorial should not be a general “guide” but rather tailored to the specific area you are focusing on. The tutorial should be created by you, and not copied directly from other material online (you are free to use any other tutorials as reference, just do not copy-paste them). Challenges should be able to be completed in about an hour.

Possible topic areas include:
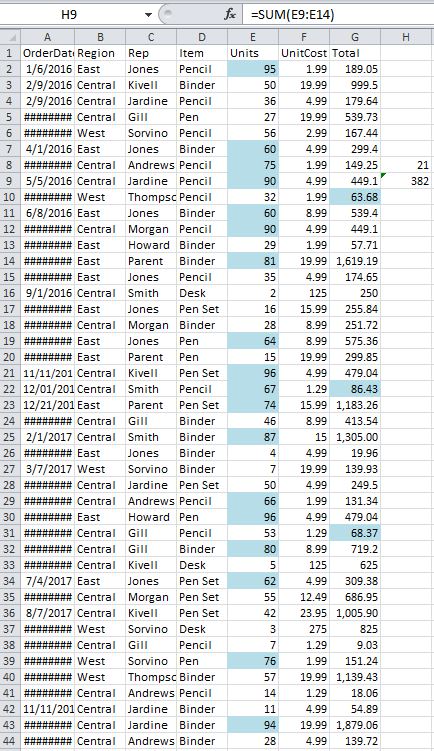
– Microsoft Office Suite (Word, Excel, Powerpoint, Access, or Publisher)
– Linux (Terminal commands, Linux specific software, Utilising a Linux OS)
– AT Software (Kurzweil, Dragon Naturally Speaking, Read and Write Gold, Inspiration)
– Programming (Scripting, web programming, language concepts)
– Any other area you’d like to focus on (See me for approval first!)

This one is a bit more open ended than our usual challenges, and as such, if you’re questioning your idea, please don’t hesitate to talk through it with me first, rather than finish it only for it to not meet the requirements.
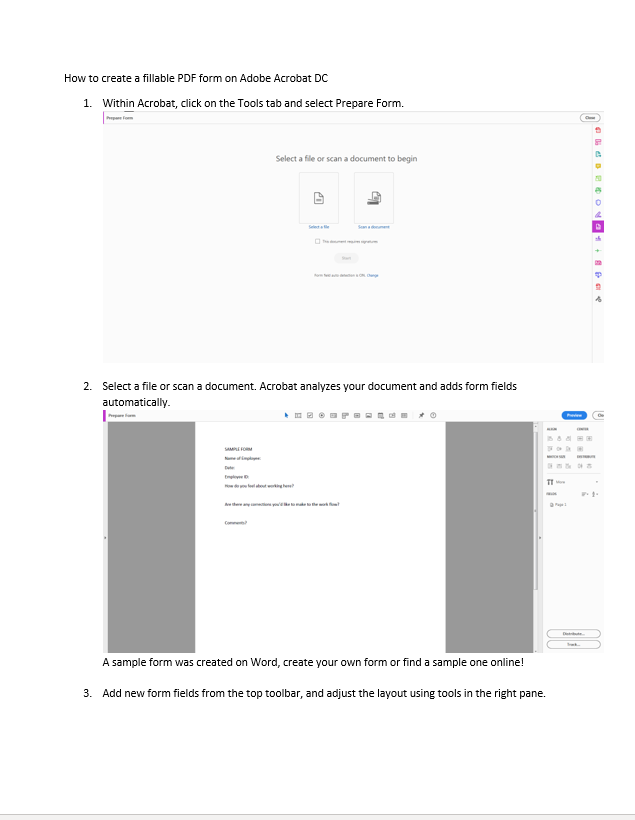
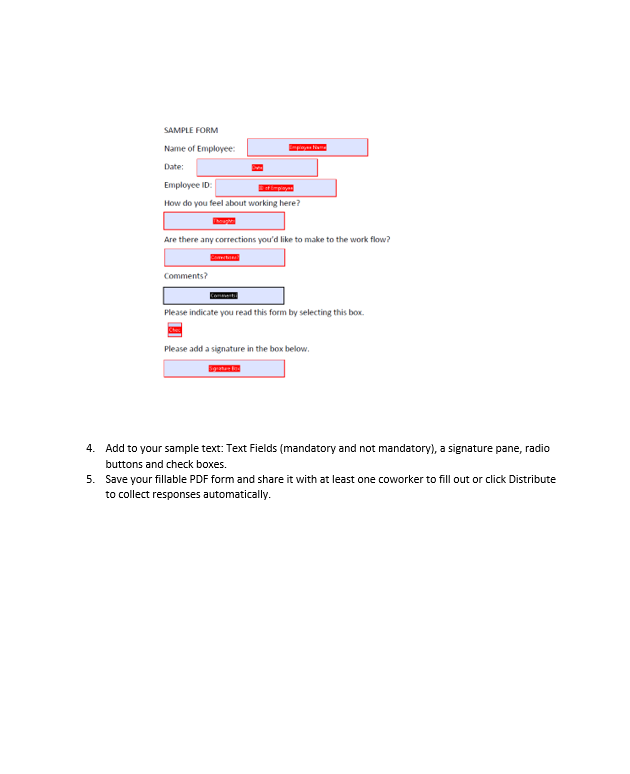
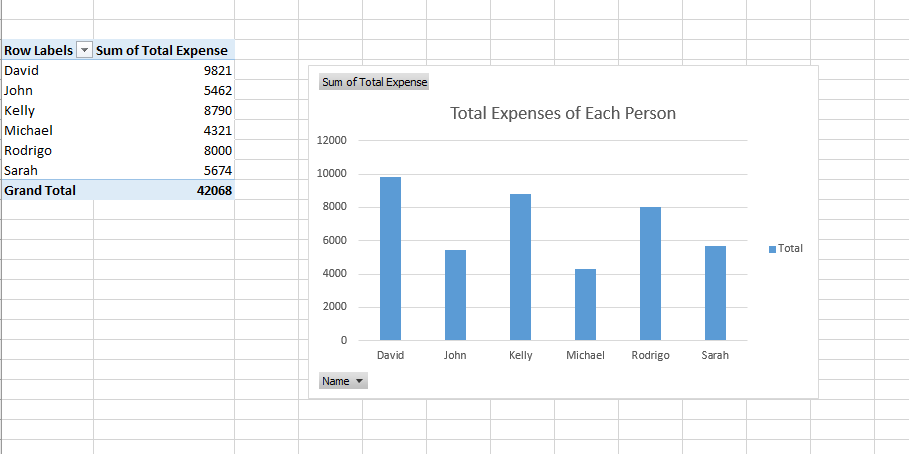
Answer:

CSW10.Final

CS Challenge W9

Question:

Pivot Tables are a powerful way to display and organize data in excel. Following the below instructions, create a pivot table from at least 3 columns and 20 rows of data (use your own created data or data found online). Modify your pivot table after generation to customize the way the data is presented in some way. Additionally, add a pivot chart to give a visual representation of your data. Submit an image of your finished table and chart as well as the excel file.

Answer:

CS Challenge W8

Question:

This challenge comes from Jacob House! This one is a bit more open ended than usual. Using one of the tools Jacob mentions in the challenge document (or any other alternative, draw.io is another online, easy to use chart tool that I recommend) complete a flowchart showing steps to complete some work related task/fix some work problem (it does not have to necessarily be a LabNet issue as outlined in the document, it can be a flow chart for any work related task such as completing the rounds, helping a client with email set up, troubleshooting a faulty monitor, helping with excel formulas, etc.) I’d like these flowcharts to be as accurate as possible, so if in doubt please consult the documentation on Bitrix or ask a supervisor for clarification before submitting. This challenge is more about the troubleshooting process, so accuracy is crucial.

Answer:

CS Challenge W7

Question:

Using your own created data (at least 3 columns and 6 rows), follow the below linked instructions on how to create a combination chart in excel. Create a combination chart with one series on the primary axis and one on the secondary axis, separate axis titles and labels, a graph title, and graph legend. Include your submission as an excel file.

Answer:

CS Challenge W6

Question:

The return of sololearn! This week, we’re going to learn a bit about HTML. Complete at least the first 3 sections of the HTML course on https://www.sololearn.com and post a screenshot of your progress.

For those of you already familiar with HTML, you can click the “Take A Shortcut” button to be tested on your proficiency and get credit for all the sections previous to the test. Feel free to utilize this if you feel comfortable enough with the language already.

Answer:

CS Challenge W2

Question:

This week’s challenge comes courtesy of Anush! Following the attached tutorial, create a brush photo in PowerPoint with an image of your choosing. The font used to style the photo and styling of the brush photo that comes out is up to you!

Answer:

CS Challenge W1

Question:
This week’s challenge comes courtesy of Cliff! Follow each step of the attached .pdf tutorial to become familiar with the Excel functions IF, VLOOKUP, and COUNTIF. Using the datasheet provided, follow step 5 in the tutorial and attach your completed sheet in your response. In addition to the requested data in step 5, add 3 more columns/cells showcasing each function used in another customized manner (e.g. you could add an IF column that displays “Is rich” If a person’s salary is greater than 5000)
Answer:

Link: CSW1.02

CS Challenge W10

Question: Create an excel file with your marks for a hypothetical course. You are heading into the final exam and trying to figure out with grade that you need to get on the final exam to get a mark good enough to get into grad school.  You will use Excel’s What If function to figure this out. Create a second column of data. Enter in how many hours that you studied/worked for each assignment/test. Create a bar graph with TWO data series, one for grades and a second for the hours .

Answer: Link to Excel sheet

CS Challenge W9

Question: Creating your own graphics can make a presentation or report look really slick! Create a fake logo using the free image editor Gimp You will probably need to download and install it if you do not already have it on your computer.
Add your own initials inside the sphere and unique gradient colours. Save it will as a PNG with a transparent background and post the png as a reply to this tread.

Answer: 

CS Challenge W7

Question: In Excel, demonstrate conditional formatting, the countif function, and 1 other function of your own choosing. You will need to find or create your own data for this!

Answer: Conditional Formatting: Cells highlighted if the value of the units and the total were between the numbers 60-100
Countif was used to see how many of the dates were above 11/01/2016
And for the use your own, I used the sum function to calculate the added total of blocks E9 to E14

File Link: CS.w7