Week 10 – Excel

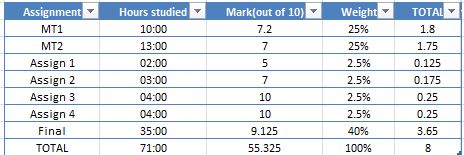
Create an excel file with your marks for a hypothetical course. You are heading into the final exam and trying to figure out with grade that you need to get on the final exam to get a mark good enough to get into grad school.  You will use Excel’s What If function to figure this out.

https://www.gcflearnfree.org/excel2016…nalysis/1/

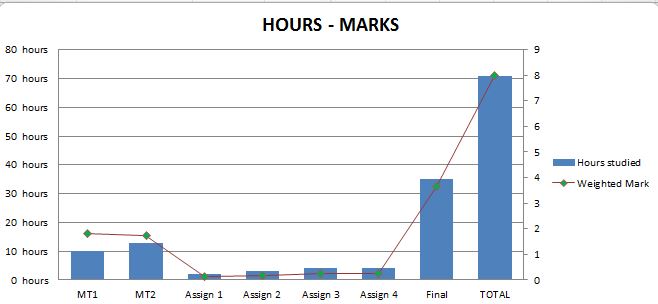
Create a second column of data. Enter in how many hours that you studied/worked for each assignment/test. Create a bar graph with TWO data series, one for grades and a second for the hours .

Post your completed excel file in a reply to this thread. 

Below are the table and chart that resulted from this challenge.
Week 9 – Gimp

Creating your own graphics can make a presentation or report look really slick! Create a fake logo using the free image editor Gimp You will probably need to download and install it if you do not already have it on your computer. https://www.gimp.org/
Add your own initials inside the sphere and unique gradient colours. Save it will as a PNG with a transparent background and post the png as a reply to this tread. Tutorial https://www.gimpshop.com/tutorials/how…ate-a-logo

This was the result:

Week 8 – Mail Merge

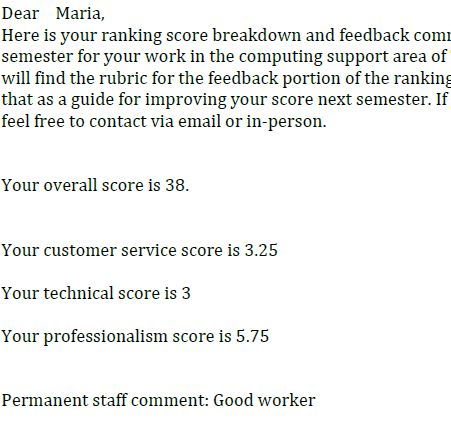
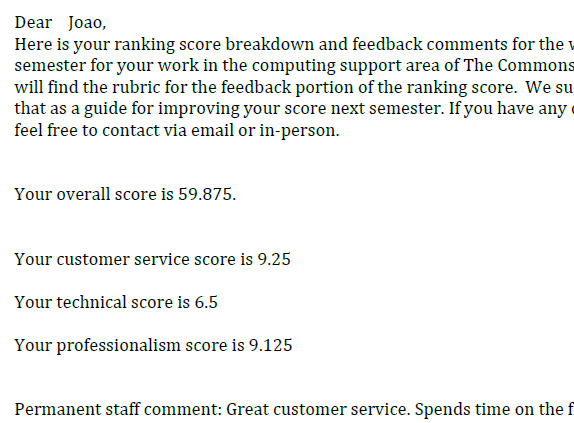
Mail Merge gives you a lot of flexibility when it comes to generating the same document for a number of users and purposes. Send ranking scores to 12 imaginary Commons staff.

Your letters should include:
– their name
– their overall score
– separate scores for customer service, technical and professionalism
– 1 short comment about something they do well.

Tutorial can be found here

Additional tutorial if helpful
Tutorial (text, no audio needed) for 2007 but should function the same

This a very interesting challenge that might be really useful in the future. The guide was very straightforward and I thought it would be nice to use names commonly seen in Brazil. Here are some screenshots:

Week 7 – More Excel

In Excel, demonstrate conditional formatting, the countif function, and 1 other function of your own choosing. You will need to find or create your own data for this!
TUTORIAL (Conditional Formatting)
TUTORIAL (Countif Function)Upload your file as a response to this post.
I used conditional formatting with icons to mark all the invalid data (suspected outliers), and the COUNTIF function to count the occurrences in the dataset that fell between a certain range. I also used the CONCATENATE function to format the headers and two other functions to generate the dataset, RAND and RANDBETWEEN. The first generates random numbers between 0 and 1 (to compose the fractional part of the number) and the second generates integers in a range specified by the user. I also created a secondary dataset out of matrix products. I calculated the average and standard deviation of the two datasets by using the AVERAGE AND STDEVP formulas.

Week 5 – Excel

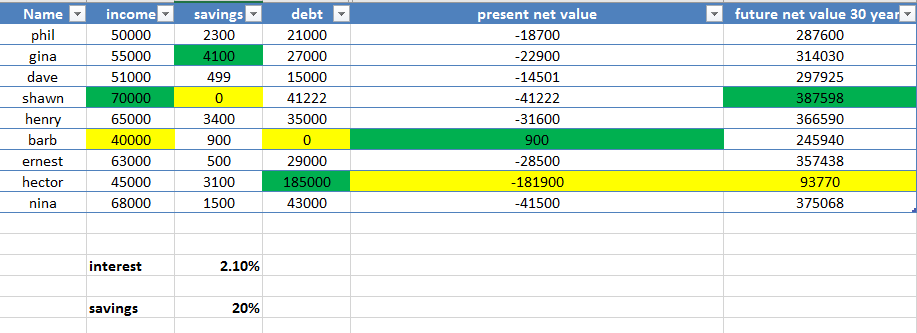
Use the following excel file and data to present net value (total worth) and future net value (ignoring compounding). Here are the formulas that you will need. Use absolute cell referencing in your equations.

PNV (present net value) = savings – debt
FNV (future net value) = (income * saving % * 30) + (income * saving % * 30 * interest) + PNV

Use conditional formatting to highlight in the cell in green with the highest number for each category of income, savings, debt, saving %, PNV and FNV. Do the same for the lowest number in yellow.

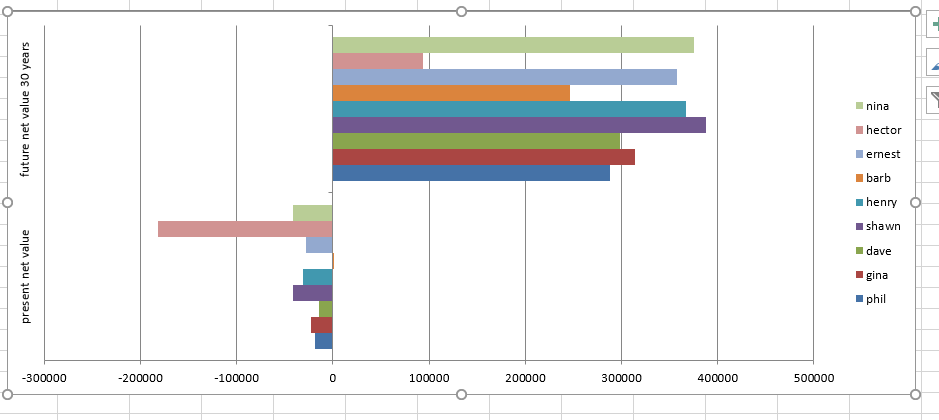
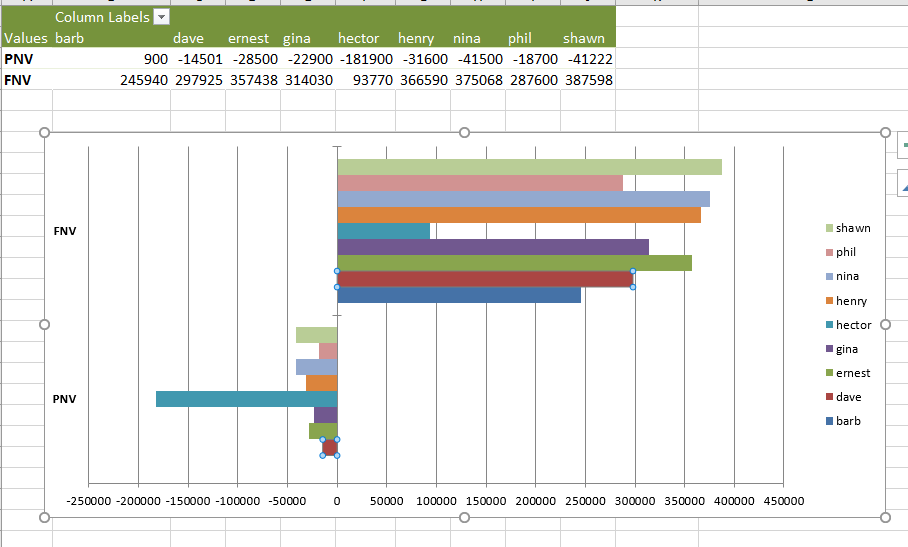
On a separate sheet, make a bar graph with two series of data, future net value and present net value. 

Data is attached

I really liked this challenge, it was good to refresh some skills and I took the opportunity to make the bar graph in two ways, first by using the conventional chart tool and then by using a pivot chart.

Here are some pics:

Here’s the file: winter CS w5 data_Henrique

Week 4 – EXCEL VLOOKUP

The challenge is to use VLOOKUP function, one of the lookup and reference functions. You should use VLOOKUP when you need to look in a single row or column and find a value from the same position in a second row or column. More info in the attached PDF.

Post your working excel vlookup function spreadsheet as a reply to this post. 

I decided to do something different on this challenge and added a button containing a refresh macro. Every time the user presses the button “Feeling lucky?” the product number changes and so does the data retrieved by the VLOOKUP function. Here’s an illustration:

Here’s the file: VLOOKUP Data_Henrique

Week 3 – Intro to Latex

Using the attached PDF tutorial from our very own tech guru Rick Kelly, your challenge is to make a .tex file containing:

  • Multiple sections and subsections
  • Table of contents
  • At least one equation
  • A list
  • One other interesting feature (lots of LaTeX resources on Google!) not covered here, such as:– Table
    – Figure (image)
    – Cover page
    – Short bibliography
    – Use of another environment not covered hereSubmit the compiled PDF and the .tex file as a reply to this post.

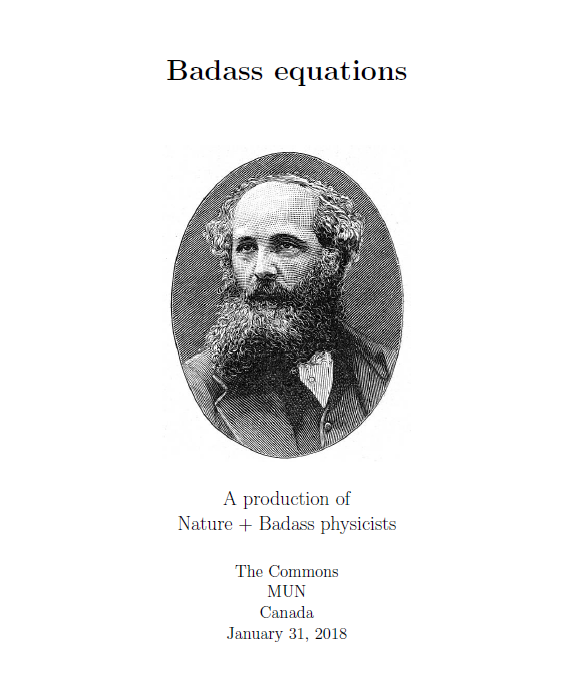
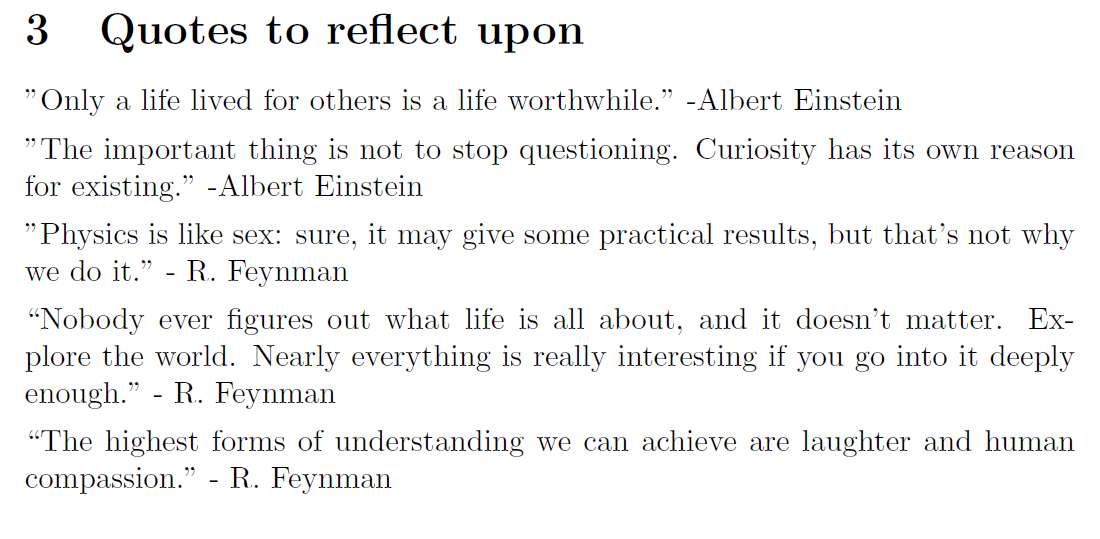
This is the file I created for this challenge. I chose to inserted a few complex equations and a figure.

PDF FILE: CS_w3_Henrique

Here are some screenshots of it: 

Week 2 – Intro to Programming

We are using Bheem Seewoodharry challenge to wrap our heads around some fundamental programming concepts through the use of an educational program called “Scratch“. Read the attached tutorial created by Bheem. 

Your submission will be a short animation and it must include THREE animated sprites. One of the sprites should be a cutout image of YOU! You are able to erase the background in images within Scratch. Post your finished product as a youtube video in a reply to this post. 

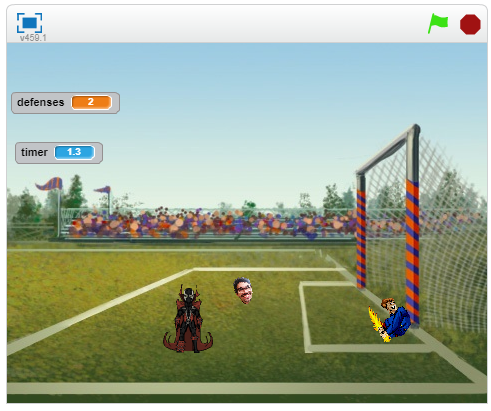
In this week we had to used Scratch to create a short animation that included at least a sprite with our face.

Here’s the youtube link.

Here’s the scratch link, where you can actually play around with it.

This is what it looks like:


Week 1 – Word Track Changes

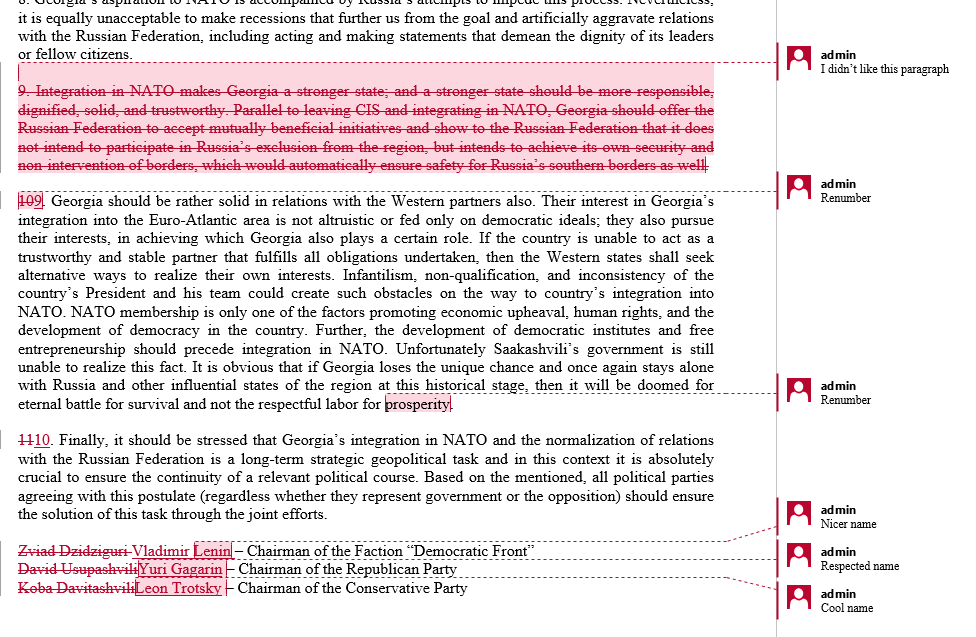
This week’s challenge comes from Raahyma Ahmad! Find a sample document online that is approximately 2 pages (or one that is bigger and just use 2 pages of it). Go by the attached pdf tutorial and use the Tracking changes and comments feature on word to revise and edit a document. 


In this challenge I decided to track the changes that I did to a document I found online. Below there’s a screenshot of the changes I did to the document; although invisible in the final version of the document, these alteration can be made visible if the review tool is activated. Below, there’s a screenshot of the changes made and a link to the file used in the process.

File: Georgia_opposition_NATO_rev