Question: Create an excel file with your marks for a hypothetical course. You are heading into the final exam and trying to figure out with grade that you need to get on the final exam to get a mark good enough to get into grad school. You will use Excel’s What If function to figure this out. Create a second column of data. Enter in how many hours that you studied/worked for each assignment/test. Create a bar graph with TWO data series, one for grades and a second for the hours .
Answer: 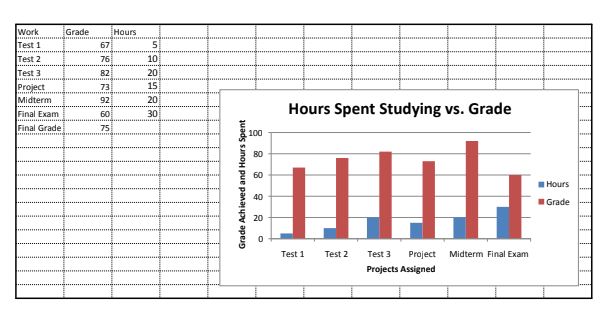 Link to Excel sheet