Question:
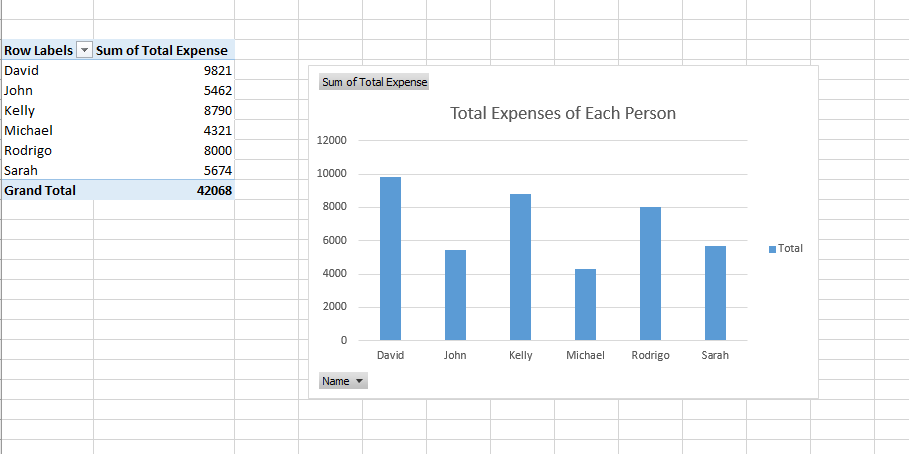
Pivot Tables are a powerful way to display and organize data in excel. Following the below instructions, create a pivot table from at least 3 columns and 20 rows of data (use your own created data or data found online). Modify your pivot table after generation to customize the way the data is presented in some way. Additionally, add a pivot chart to give a visual representation of your data. Submit an image of your finished table and chart as well as the excel file.
Answer: