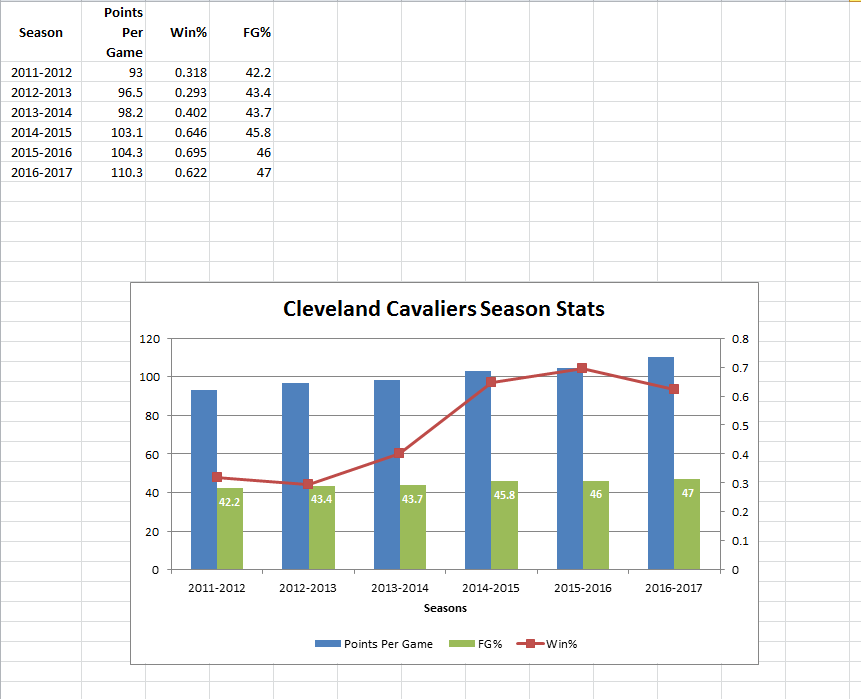
Using your own created data (at least 3 columns and 6 rows), follow the below linked instructions on how to create a combination chart in excel. Create a combination chart with one series on the primary axis and one on the secondary axis, separate axis titles and labels, a graph title, and graph legend. Include your submission as an excel file.
Due November 6 at noon.
Instructions for Office 2010 – https://www.microsoft.com/en-us/microsoft-365/blog/2012/06/21/combining-chart-types-adding-a-second-axis/
Instructions for Office 2013/2016 – https://support.office.com/en-gb/article/video-create-a-combo-chart-c7921539-cda8-4913-9cd7-170f372d21a2
My submission: