Week 2 – Photography with a flash

Using our external flash and wireless triggers, create six versions of someone portrait as illustrated in the attached handout. Combine all six headshot into a single jpg and post as a reply. 

The trigger attached to the flash should be set to “Rx”. The trigger attached to the camera should be set to “Tx”.   

Week 10 – Excel

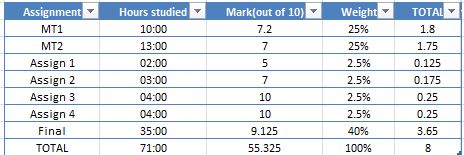
Create an excel file with your marks for a hypothetical course. You are heading into the final exam and trying to figure out with grade that you need to get on the final exam to get a mark good enough to get into grad school.  You will use Excel’s What If function to figure this out.

https://www.gcflearnfree.org/excel2016…nalysis/1/

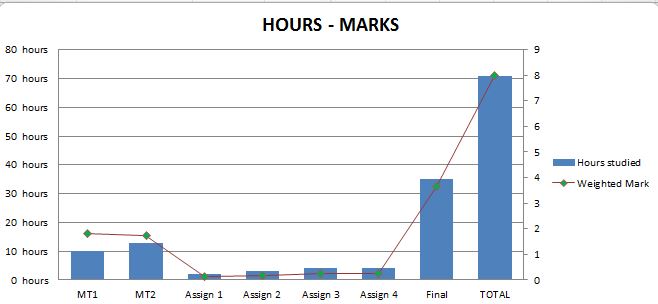
Create a second column of data. Enter in how many hours that you studied/worked for each assignment/test. Create a bar graph with TWO data series, one for grades and a second for the hours .

Post your completed excel file in a reply to this thread. 

Below are the table and chart that resulted from this challenge.

Week 9 – Gimp

Creating your own graphics can make a presentation or report look really slick! Create a fake logo using the free image editor Gimp You will probably need to download and install it if you do not already have it on your computer. https://www.gimp.org/
Add your own initials inside the sphere and unique gradient colours. Save it will as a PNG with a transparent background and post the png as a reply to this tread. Tutorial https://www.gimpshop.com/tutorials/how…ate-a-logo

This was the result:

Week 8 – Mail Merge

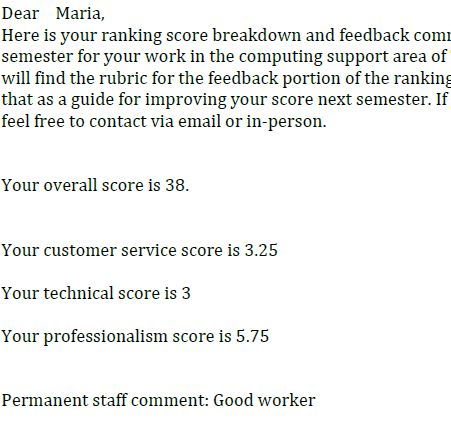
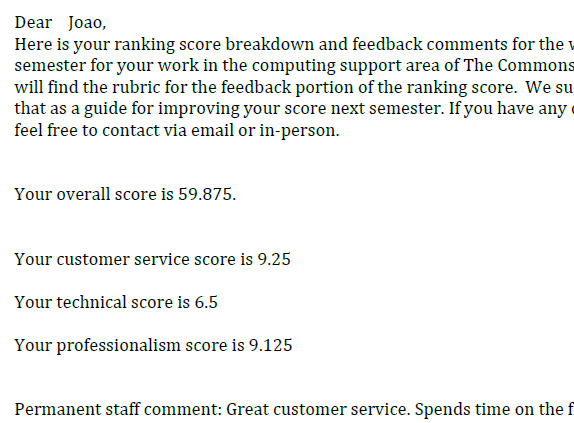
Mail Merge gives you a lot of flexibility when it comes to generating the same document for a number of users and purposes. Send ranking scores to 12 imaginary Commons staff.

Your letters should include:
– their name
– their overall score
– separate scores for customer service, technical and professionalism
– 1 short comment about something they do well.

Tutorial can be found here

Additional tutorial if helpful
Tutorial (text, no audio needed) for 2007 but should function the same

This a very interesting challenge that might be really useful in the future. The guide was very straightforward and I thought it would be nice to use names commonly seen in Brazil. Here are some screenshots:

Week 7 – More Excel

In Excel, demonstrate conditional formatting, the countif function, and 1 other function of your own choosing. You will need to find or create your own data for this!
TUTORIAL (Conditional Formatting)
TUTORIAL (Countif Function)Upload your file as a response to this post.
I used conditional formatting with icons to mark all the invalid data (suspected outliers), and the COUNTIF function to count the occurrences in the dataset that fell between a certain range. I also used the CONCATENATE function to format the headers and two other functions to generate the dataset, RAND and RANDBETWEEN. The first generates random numbers between 0 and 1 (to compose the fractional part of the number) and the second generates integers in a range specified by the user. I also created a secondary dataset out of matrix products. I calculated the average and standard deviation of the two datasets by using the AVERAGE AND STDEVP formulas.